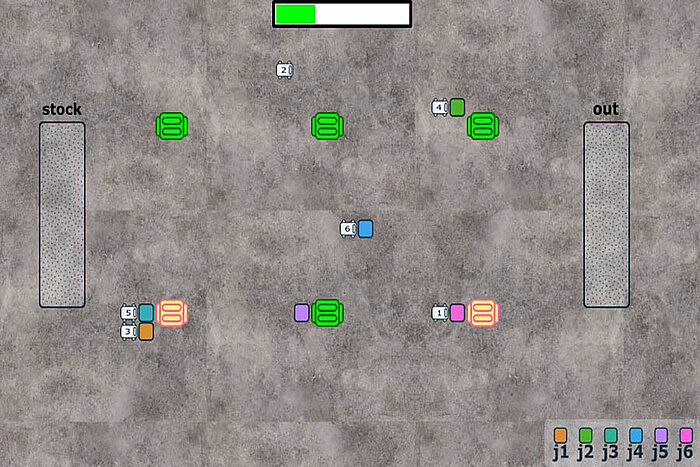
Another milestone has been reached in the "A-IQ Ready" project. A visualization tool has now been created for the self-developped fleet management algorithm to solve the job shop scheduling problem which significantly speeds up the evaluation of the software, including bug fixing. Image and video simulation data can be used to visually determine whether the applied algorithm ensures optimum utilization of production machines and AGVs. For example, it becomes immediately apparent if individual machines are overloaded with orders compared to others or if individual AGVs are traveling too long distances or have excessive downtimes. The learning-based software continuously optimizes itself, identifying the shortest distances between current AGV locations and machines for upcoming component/product transports or guiding a free AGV to a machine even before the current task is finished to completely eliminate waiting times. Over time, the learning software can develop optimal strategies which a human would probably not be able to achieve.
In the next step, the algorithm trained in the model will then be transferred to the real production environment in proto_lab via Sim2Real. To ensure this success, the self-developed algorithm has already been closely aligned with the ScaliRo software for controlling the AGVs.